Computational Social Journalism
a website to discuss the meeting point of journalism and computational social science
While pursuing my Master’s, together with a colleague I created a website called Computational Social Journalism. Computational social journalism (CSJ) describes a personal vision of future journalism. A vision we tried to follow in developing projects on this blog.
CSJ, as a term, is a reference to the academic discipline of computational social science. Rising hand in hand with digitalization, computational social science connects the usage of computers to scientifically display, explain or analyze a broad range of ‘social phenomena’. Personally attached with an interest in digital journalism and storytelling and the academic studies of computational social science, we aim to combine both these fields, naming it computational social journalism.


My contributions to the blog included the following posts:
- Inside data journalism academia: the network properties and actors shaping research on computational and data journalism
- So changing your privacy settings may not be enough. This is what we can do about it
- Diffusion Theory for Journalists. How do we use it, and what can we learn from it?
- Save the date! Journalism conferences, training, and awards for 2022/23 - mapped and categorised
- “O bella ciao”. An analysis of Wikipedia´s “List of anti-war songs” and their related wars
- Comparing Italy and Sweden’s coronavirus outbreak
Here are some words about my favourites.
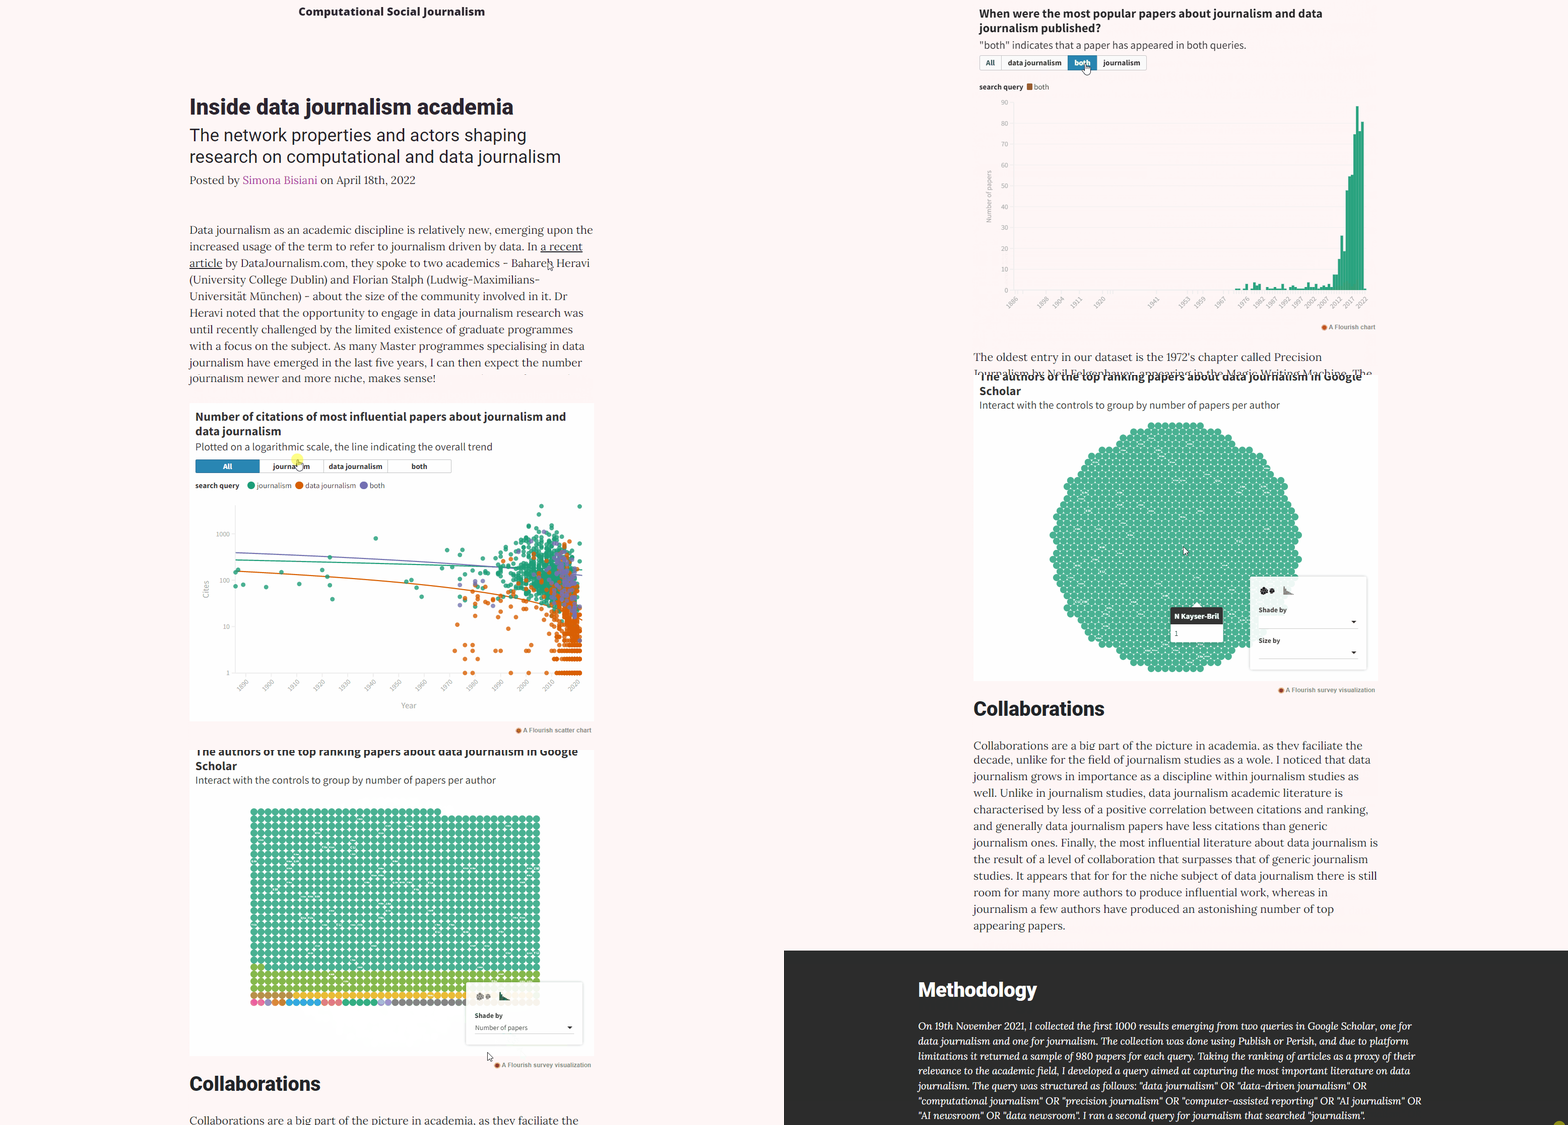
Inside data journalism academia: the network properties and actors shaping research on computational and data journalism
This was a fun project that was aimed at mapping the data journalism academic ecosystem. How many people are involved in researching this sub-field? How long has it existed for?

Save the date! Journalism conferences, training, and awards for 2022/23 - mapped and categorised
This project was meant as creating a tool for the data journalism community that would help them keep track of events happening around the globe. It was this project that taught me how to build interactive web applications from R availing of the Shiny framework.

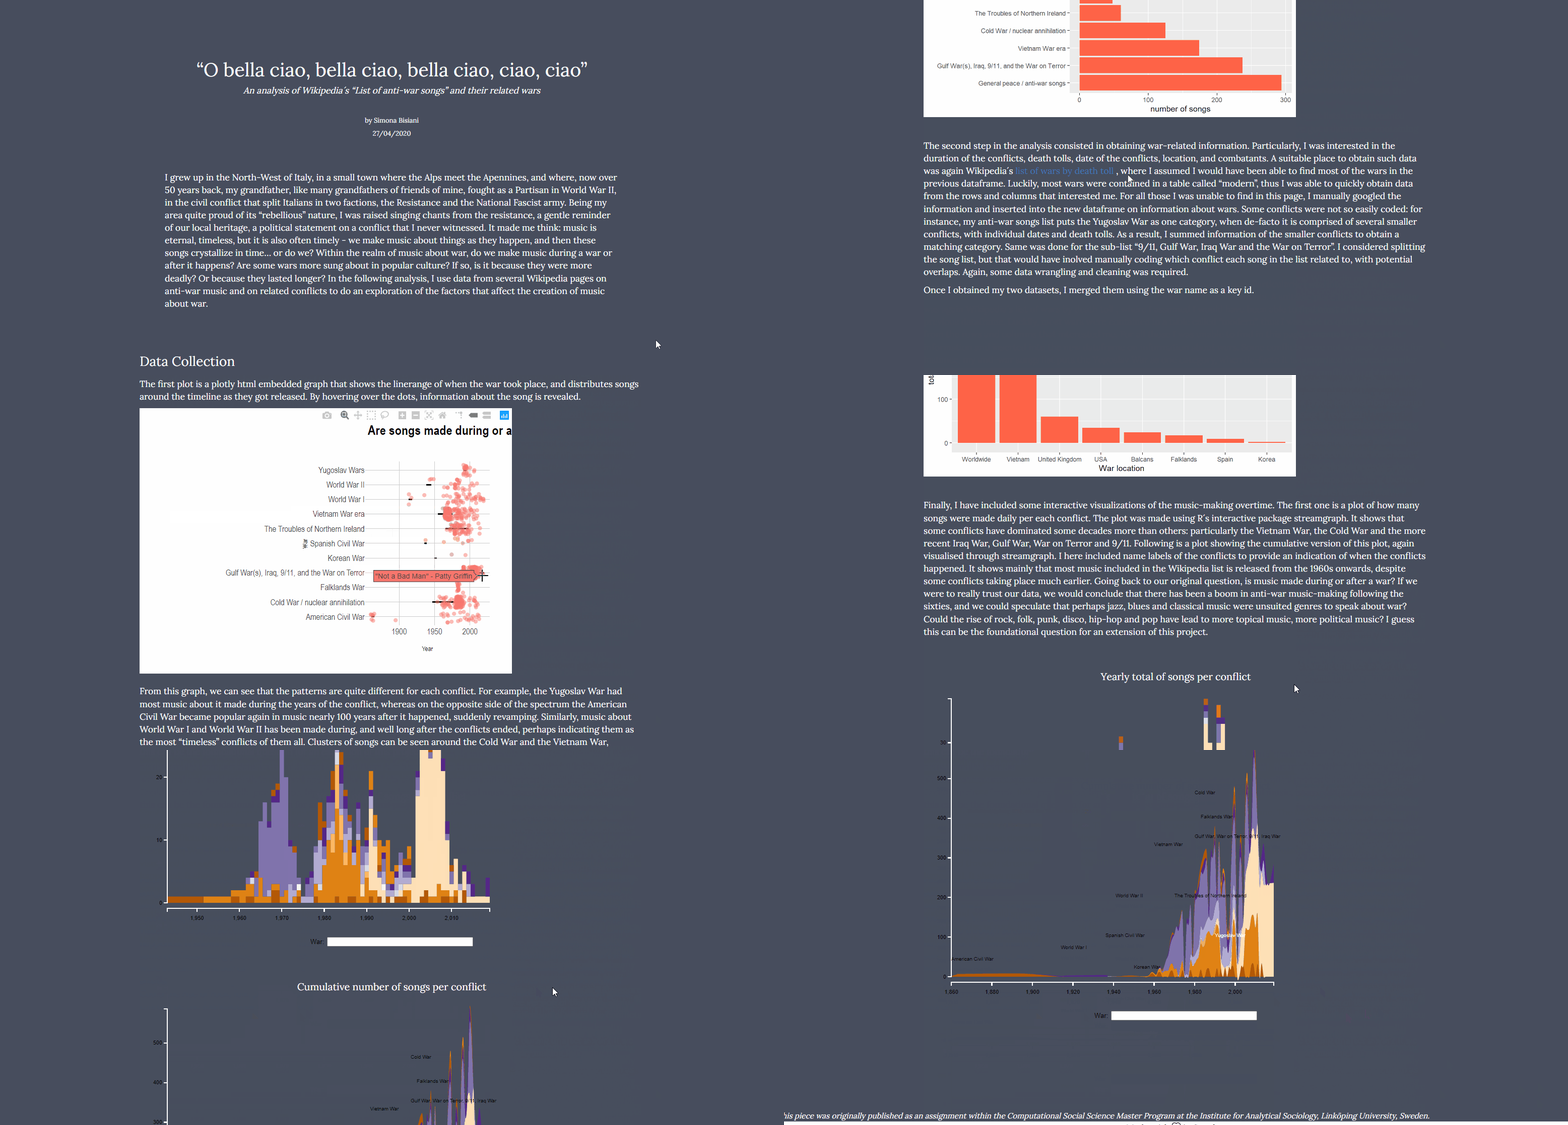
"O Bella Ciao". An analysis of Wikipedia´s “List of anti-war songs” and their related wars
I had a lot of fun doing this project. The idea was, when music about a war is made, is it during a war, afterwards, and how much afterwards? Which wars have produced more music, and which are still being spoken of in music nowadayas?
On a personal level, this project constituted my first attempt at scraping (done on Wikipedia in this case). I remember being so proud of managing to visualise the data in ggplot in R, and it feels so rewarding now seeing how far I have come in terms of data visualisation knowledge and skills.
